Silvanus
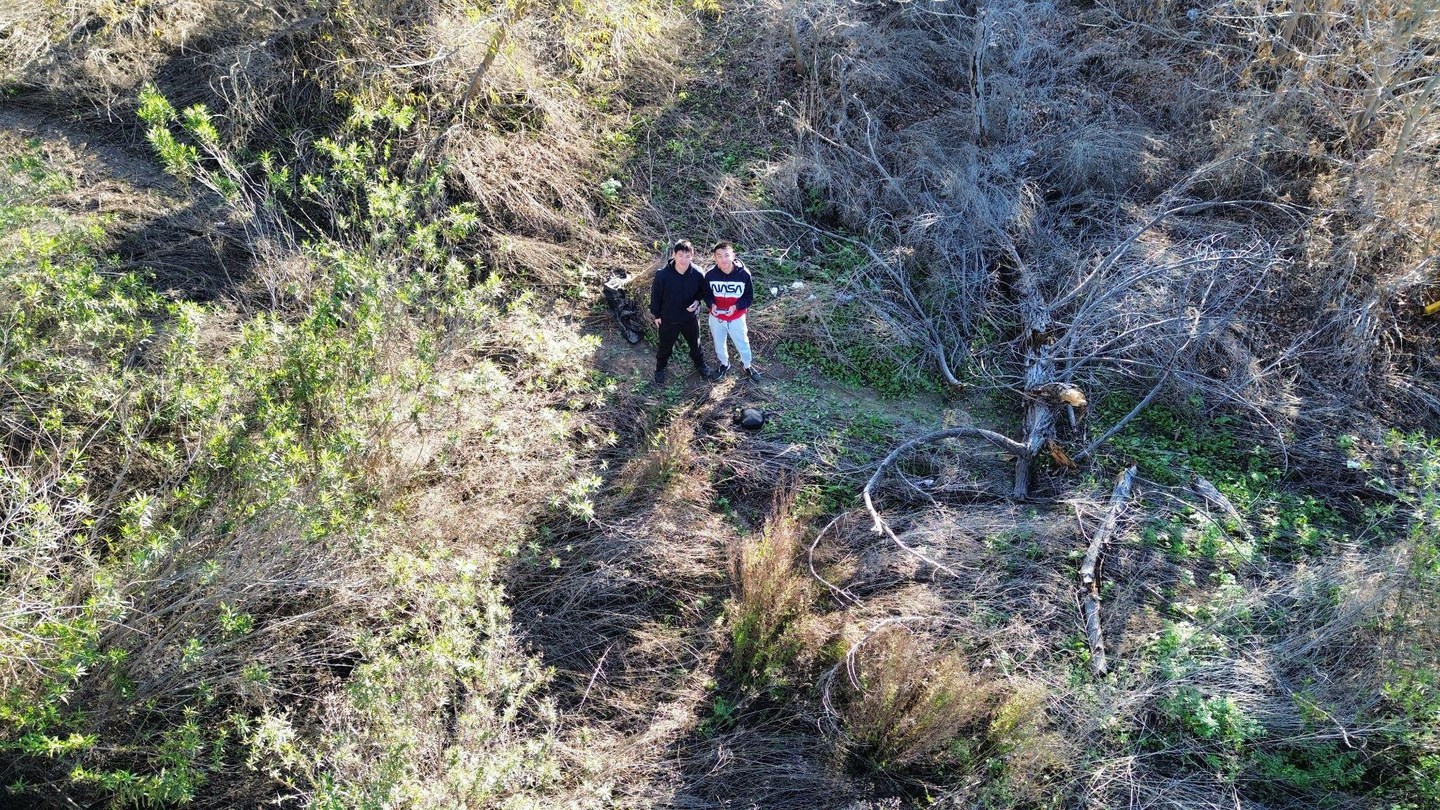
A friend and I started Silvanus to study forest canopy structure. Our idea was to estimate canopy structure from satellite data, then improve those predictions with measurements from a UAV. We shared an interest in machine learning and AI; I had also worked with competition drones, so I took on building the UAV and programming its survey flights. We developed the method and evaluated the results together. Silvanus received the Nat Lamm Memorial Award in Environmental Engineering at the Orange County Science and Engineering Fair, and we have continued the project with a study of airflow and tree temperature.
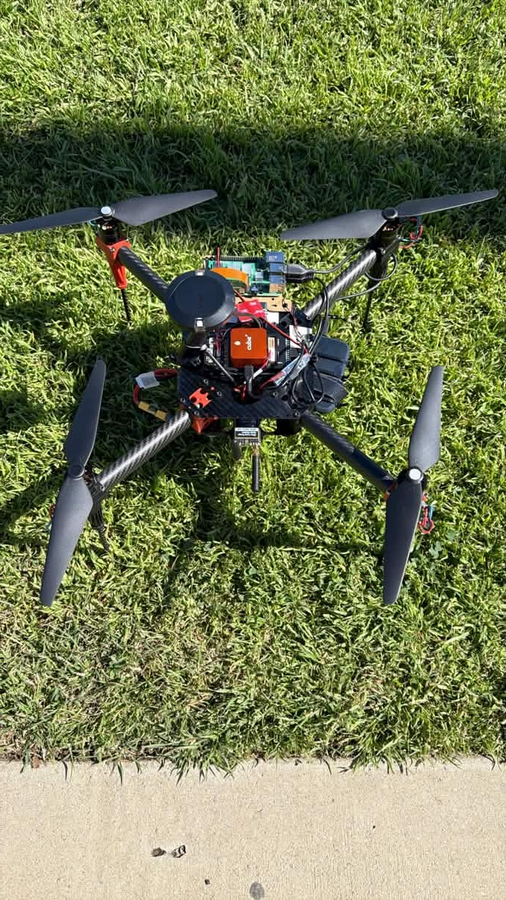
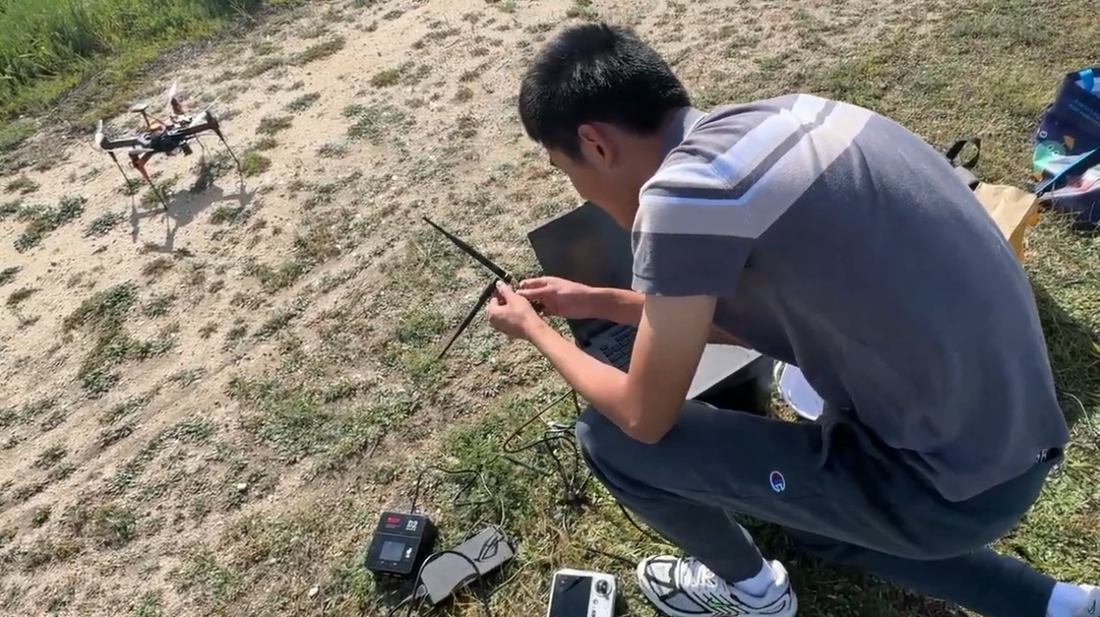
I configured the UAV's flight controller, calibrated its sensors and set up telemetry. I used a Raspberry Pi and OpenCV to capture images from its camera. My flight planner reprojects the survey map into UTM coordinates so it can space the waypoints in metres. It generates a grid of waypoints, which the flight program uploads through ROS/MAVROS. I adjusted the waypoint spacing and flight altitude so the images overlapped enough for WebODM to stitch an orthomosaic. We also changed the camera settings and vibration isolation to improve the images. A full survey took more than one battery, so I divided the area into smaller missions.
We used Sentinel-1 radar and Sentinel-2 multispectral imagery to predict canopy measurements from NASA's GEDI LiDAR. Initially our model had data from three California regions; we increased that to eight and lengthened the image-compositing period after seeing poor results on an unseen forest. In the revised model, canopy-cover R² was 0.69 with a random split. It was 0.09 to 0.47 when whole regions were held out of training. The random split could put observations from the same forest in both the training and test sets, so I thought the held-out tests were a better indication of what we could expect elsewhere.
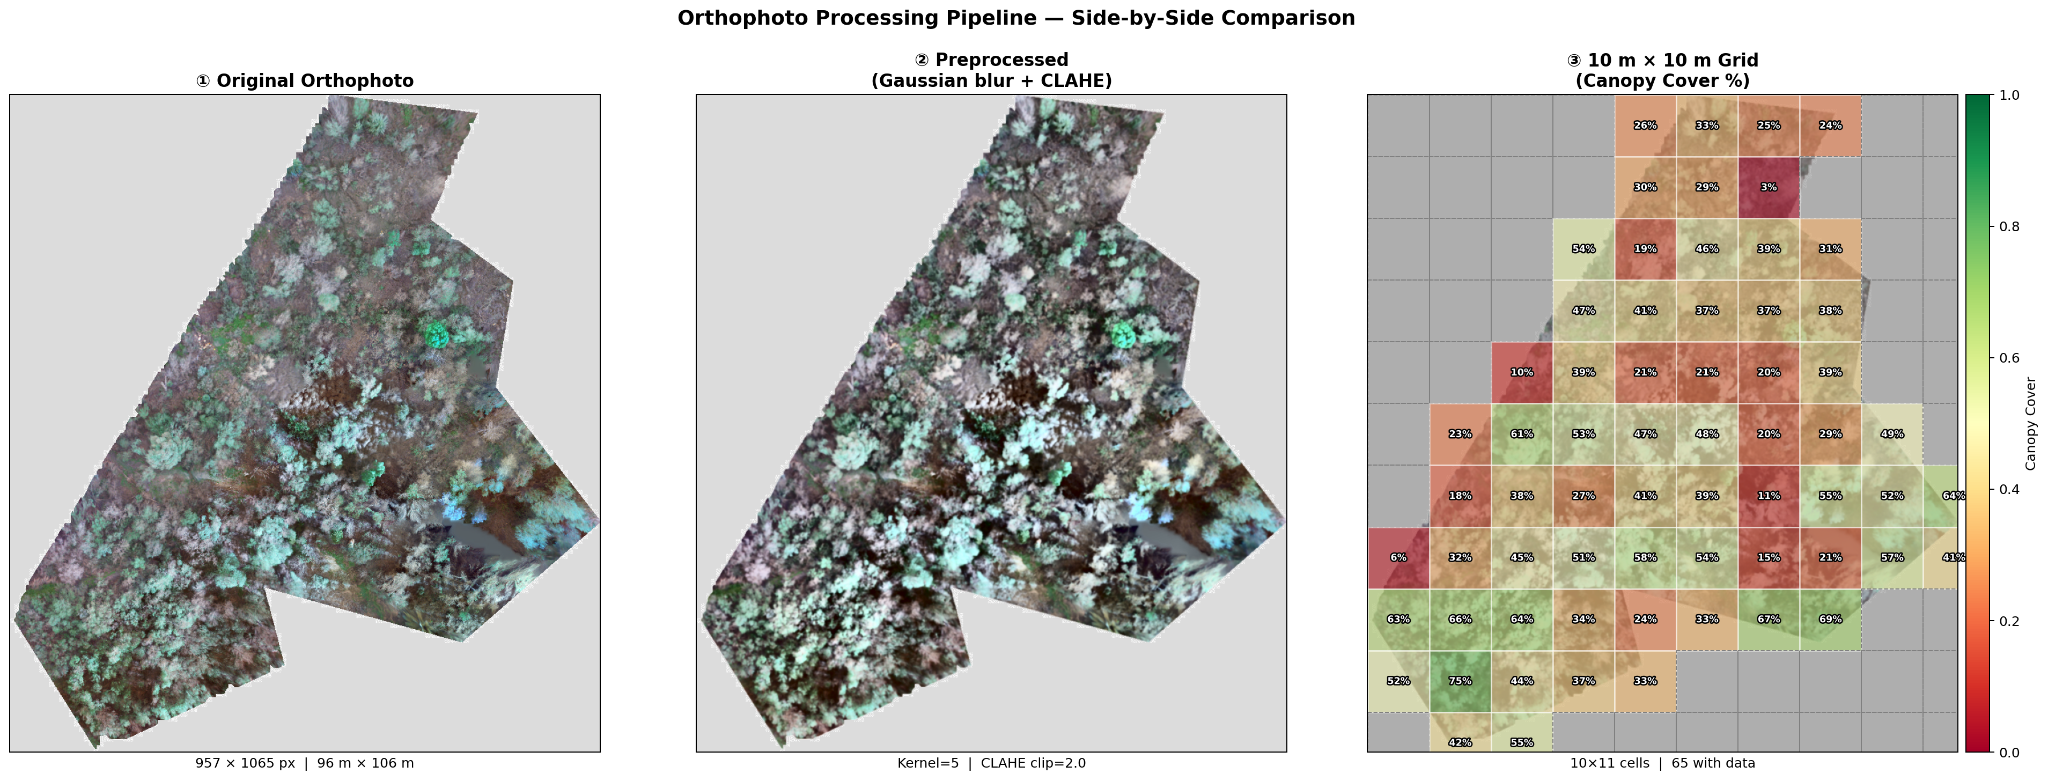
The purpose of the UAV measurements was to calibrate the satellite model. We used the orthomosaic to estimate canopy cover in 10 m by 10 m cells, as shown below, but those RGB estimates did not agree with the GEDI-derived measurements. We had treated the two sources as if they gave us interchangeable measurements of canopy cover, without accounting for the difference between them when planning the calibration. By the science fair, we could fly the UAV and produce the maps, but had not completed the calibration feedback loop.
The team has since grown to seven people working on the software, hardware and science behind Silvanus. I lead the project and work on both the software and hardware.
Our current study concerns canopy temperature and transpiration, the water lost through leaves. I read about the subject and contacted researchers, including Dr. Kevin Tu, to discuss what we could investigate. Exposed trees and sheltered trees can exchange heat with the air at different rates, yet an orchard model may assign them the same aerodynamic resistance. We want to know how much that assumption affects estimates of transpiration. We initially considered estimating resistance for each tree and validating transpiration with sap-flow sensors. That would have required enough sensors to represent the orchard's structural variation, which was not practical for us. We narrowed the study to a comparison we could make in a model.
We are developing a computational fluid dynamics study using orchard geometry reconstructed from drone photogrammetry. In the simulation, we would hold the tree crowns at a fixed temperature above the surrounding air and calculate how much heat the airflow removes. That temperature difference and heat transfer would give us an aerodynamic resistance for each tree. We could then run the canopy energy-balance calculation twice on the same orchard geometry, once with those individual resistances and once with one value for the entire orchard. The difference would show how much this assumption affects the resulting estimates of transpiration. The simulations are still in development; even after we complete them, we would need field measurements to validate estimates of actual transpiration.